
The Investment Case
Ninepoint North American
Energy Independence ETF
NYSE Arca: ENRG
WE NEED MORE ENERGY.
WHERE IT COMES FROM MATTERS.
The Fund (NYSE Arca: ENRG) seeks to invest across the companies positioned to help North America meet more of its own energy needs — producing energy, moving it, generating reliable power and supplying the strategic inputs required to expand the system.
Sub-Adviser: Ninepoint Partners LP | Ticker: ENRG | Exchange: NYSE Arca
Energy demand is rising. Secure energy and materials supply is becoming increasingly strategic. North America combines an exceptional resource base with the infrastructure, expertise and capital required to develop it. ENRG is designed to invest across the companies positioned to translate those advantages into economic value.
The Case for the Fund
Few regions are better positioned to pursue greater energy independence than North America. The United States and Canada possess an extraordinary combination of energy resources, strategic materials, infrastructure, technology and capital. These advantages include world-leading oil and natural gas production, some of the planet’s richest uranium resources, one of the world’s largest nuclear power fleets, extensive pipeline and export infrastructure, and significant deposits of copper, potash, nickel, uranium and other critical minerals. Just as importantly, these are not separate energy systems. They are already deeply interconnected, with Canada the largest single supplier of imported crude oil, natural gas and electricity to the United States. North America has much of what it needs to meet more of its own energy requirements within an established continental system.
We need more energy and greater control over where it comes from.
The Investment Case for North American Energy Independence
We are entering a new era of energy demand. Artificial intelligence and data centers, industrial reshoring, electrification and economic growth are driving the need for more electricity, more reliable power and more energy infrastructure at a pace not seen in a generation. At the same time, geopolitical fragmentation is making greater energy independence increasingly important. It is no longer enough for energy and strategic materials to be abundant and affordable. Where they come from, how reliably they can be supplied and whether we have the infrastructure to deliver them are becoming increasingly important economic advantages.
ENRG is designed to invest in companies positioned to potentially benefit as North America builds a more secure and self-sufficient energy system. Rather than concentrating on a single commodity or segment of the energy market, the Ninepoint North American Energy Independence ETF (ENRG) seeks to invest across four interconnected pillars: Energy Supply, Energy Transport, Reliable Baseload Power and Strategic Inputs. A proprietary scoring framework assesses companies across three primary criteria – North American Exposure, Strategic Importance and Reliability – and the resulting scores inform security selection and portfolio construction. The framework is considered alongside fundamental research, valuation, market conditions and portfolio considerations to identify businesses positioned to potentially benefit as rising demand, energy security and resource scarcity drive investment across the continent.
Section 1
North America Needs More Energy
For much of the past two decades, energy investing rested on a simple assumption: demand for power in developed economies was flat, and the central question was which fuel source would displace another. That assumption no longer holds. Artificial intelligence and data-center build-out, accelerating electrification, industrial reshoring, and steady population and economic growth are converging to create a structural increase in the amount of electricity and energy we must produce, move and consume. The investment question is increasingly not only how much energy we will need, but how much of that need can be met reliably from within North America itself.
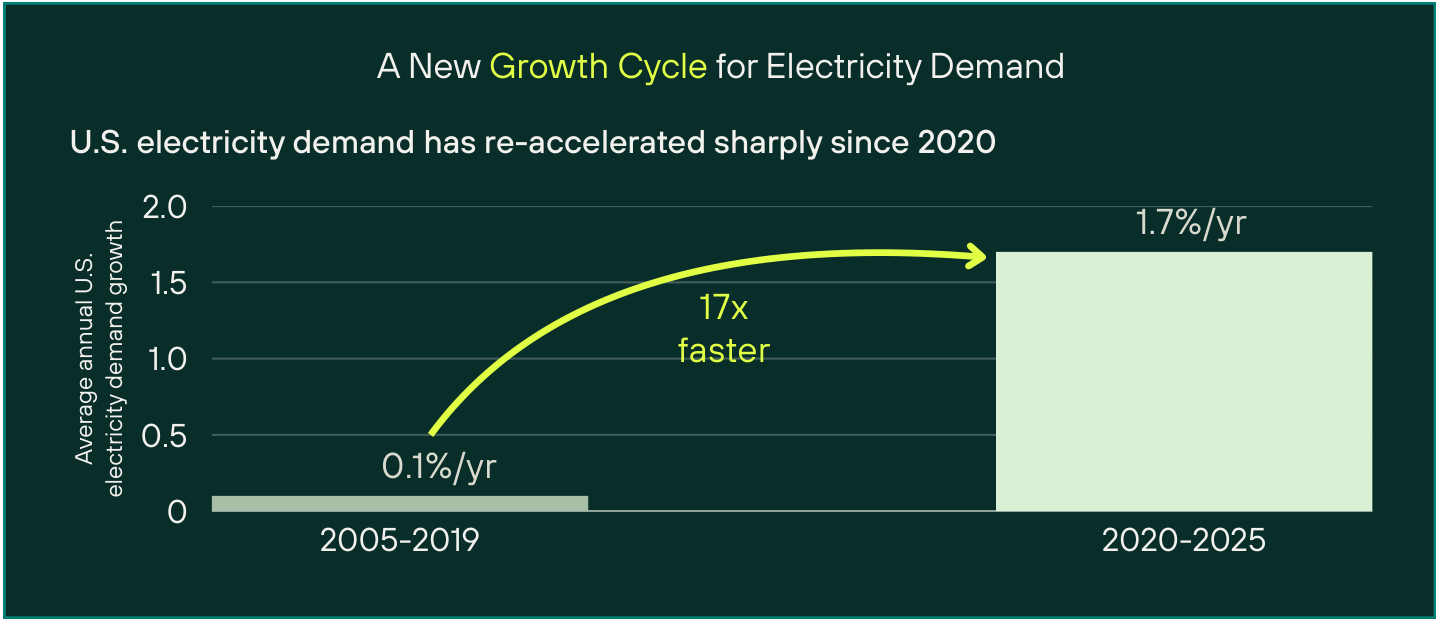
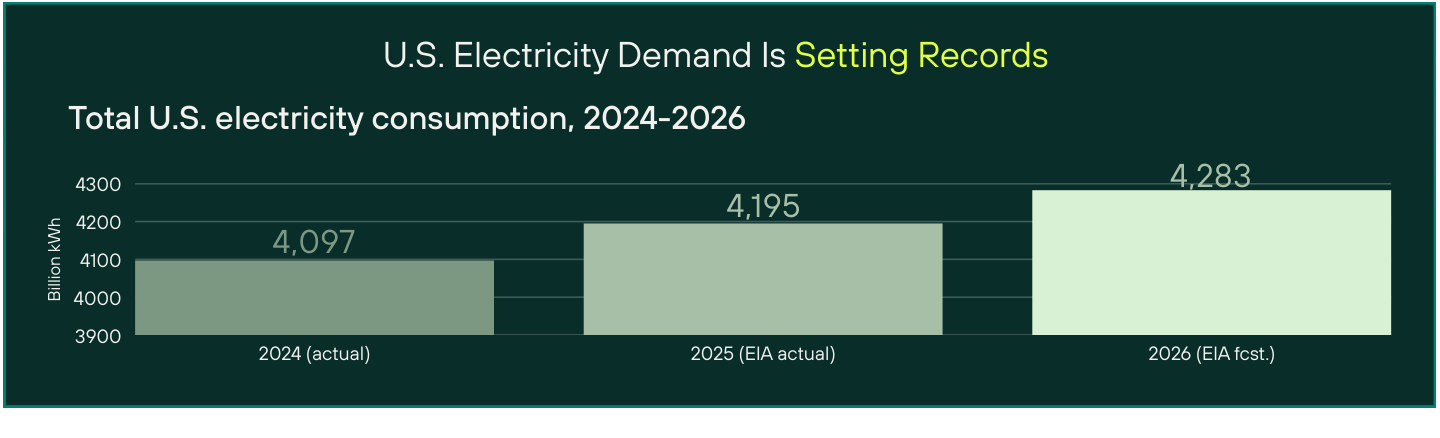
After roughly fifteen years of essentially flat consumption, U.S. electricity demand has re-accelerated sharply. EIA data show electricity demand grew at roughly 1.7% annually from 2020–2025, compared with approximately 0.1% annually from 2005–2019, a re-acceleration of seventeen times the prior period’s pace. The U.S. Energy Information Administration (EIA) reported that total U.S. electricity consumption rose to a record 4,097 billion kWh in 2024, 4,195 billion kWh in 2025 and projected to reach 4,283 billion kWh in 2026, all record highs in consecutive years.2,3 In its January 2026 outlook, the EIA projected this would mark the strongest four-year growth period for U.S. electricity demand since 2000.3
Four Demand Drivers, Converging at Once
The structural driver most visible today is artificial intelligence and data-center build-out. The EIA’s Annual Energy Outlook 2026 projects that, under a high-demand case, U.S. data-center server electricity consumption could reach 818 billion kWh by 2050, more than sixteen times 2020 levels, while total U.S. generating capacity may need to rise by 50% to nearly 90% by mid-century.4,5
The Electric Power Research Institute (EPRI) estimates data centers could consume up to 9% to 17% of total U.S. electricity generation by 2030.6 That growing demand is expected to contribute meaningfully to a broader increase in U.S. electricity consumption, which is projected to rise by more than 420 TWh between 2025 and 2030, with data centers expected to account for roughly half of that increase.7 Overall, global electricity demand is projected to grow 3.6% annually through 2030, about 29% faster than the prior decade’s pace.7
But AI is only one driver among several moving in the same direction at once. Manufacturing reshoring and industrial policy across North America are adding large, energy-intensive loads at the same time the grid is absorbing data-center growth. New semiconductor fabrication, battery and EV manufacturing, and broader industrial-reshoring initiatives all require abundant, secure, and competitively priced energy as a precondition, not an afterthought. The expanding electrification of transportation, heating, industrial processes and the broader economy continues to shift a greater share of energy consumption toward the grid. And steady population and economic growth add a durable underlying baseline of demand beneath all three.
Together, these forces point to more than a temporary spike in consumption. They describe a new, multi-decade cycle for energy, one the existing system was not built to absorb passively.
The IEA estimates more than 2,500 gigawatts of generation, storage, and large-load projects are currently stalled in grid interconnection queues worldwide, and that meeting forecast demand through 2030 will require annual grid investment to rise by roughly 50% from today’s approximately $400 billion base.8 Reliable, dispatchable power and the infrastructure to move and manage it, are quickly becoming a constraint on economic growth and a potential source of investment opportunity.
The implication for investors may be straightforward: We need substantially more energy capacity, and greater energy independence increases the strategic value of building that capacity within an integrated continental system.
Section 2
Energy Independence Has Become Economic Security
For several decades, the dominant assumption in energy and materials markets was that countries did not need to control production domestically, because globally optimized supply chains would deliver what was needed, where it was needed, at the lowest available cost. Geography and politics were treated as secondary to price. That assumption is now being tested.
That assumption has weakened considerably. Russia’s invasion of Ukraine and the sanctions regime that followed exposed how quickly energy flows can be weaponized. Rising U.S.–China tensions have placed technology and materials supply chains at the center of great-power competition. Instability across the Middle East continues to threaten a region that still moves a substantial share of the world’s oil and gas. And the discovery that a handful of jurisdictions, several of them politically unpredictable, control the refining and processing of the critical minerals that modern economies depend on has turned resource concentration into a first-order economic risk, not a footnote.
China’s position in critical-mineral processing illustrates the scale of that concentration. Independent of where ore is mined, China refines roughly 91% of the world’s rare earth elements9, 44% of refined copper10, and as of 2025 according to the IEA, approximately 70% of global refined production of key energy minerals11. Mining is relatively distributed around the world; refining, the step that turns raw ore into usable material, is one of the most geographically concentrated activities on earth. A processing chokepoint is only a latent risk until it is used. In April 2025, China did, introducing export controls on a set of heavy rare earths and rare-earth magnets.
Two Strategic Inputs Under Growing Supply Pressure
Uranium
Structural deficit
Global mine production is falling short of reactor requirements. Sprott and Goldman Sachs both project the deficit widening through the 2030s as reactor restarts and new builds outpace new mine supply.
Copper
Supply Swings
The International Copper Study Group (ICSG) forecasts for the refined copper market have swung sharply within the past year, from an initial 2026 surplus, to a 150,000-ton deficit forecast in October 2025, back to a projected 96,000-ton surplus in ICSG’s most recent April 2026 update12, underscoring how sensitive near-term balances are to shifting demand and secondary supply assumptions.
Source: World Nuclear Association, World Nuclear Fuel Report 2025; Sprott Asset Management (2026); Goldman Sachs uranium supply-demand model (Dec. 2025); International Copper Study Group (ICSG), 2026 forecasts; S&P Global, “Copper in the Age of AI” (Jan. 2026).
Supply constraints are also affecting the raw materials themselves, regardless of where they are processed. The International Copper Study Group (ICSG) forecasts for the refined copper market have swung sharply within the past year, from an initial 2026 surplus, to a 150,000-ton deficit forecast in October 2025, back to a projected 96,000-ton surplus in ICSG’s most recent April 2026 update12, underscoring how sensitive near-term balances are to shifting demand and secondary supply assumptions. S&P Global projects copper demand rising 50% by 2040, with production peaking around 2030.13
Uranium tells a parallel story. The World Nuclear Association’s 2025 World Nuclear Fuel Report projects global nuclear generating capacity rising from 372 GWe in 2024 to 746 GWe by 2040.14 That growth translates directly into fuel demand: global reactor uranium requirements, estimated at roughly 68,920 tU in 2025, are projected to exceed 150,000 tU by 2040, depending on how quickly new nuclear capacity is built.15
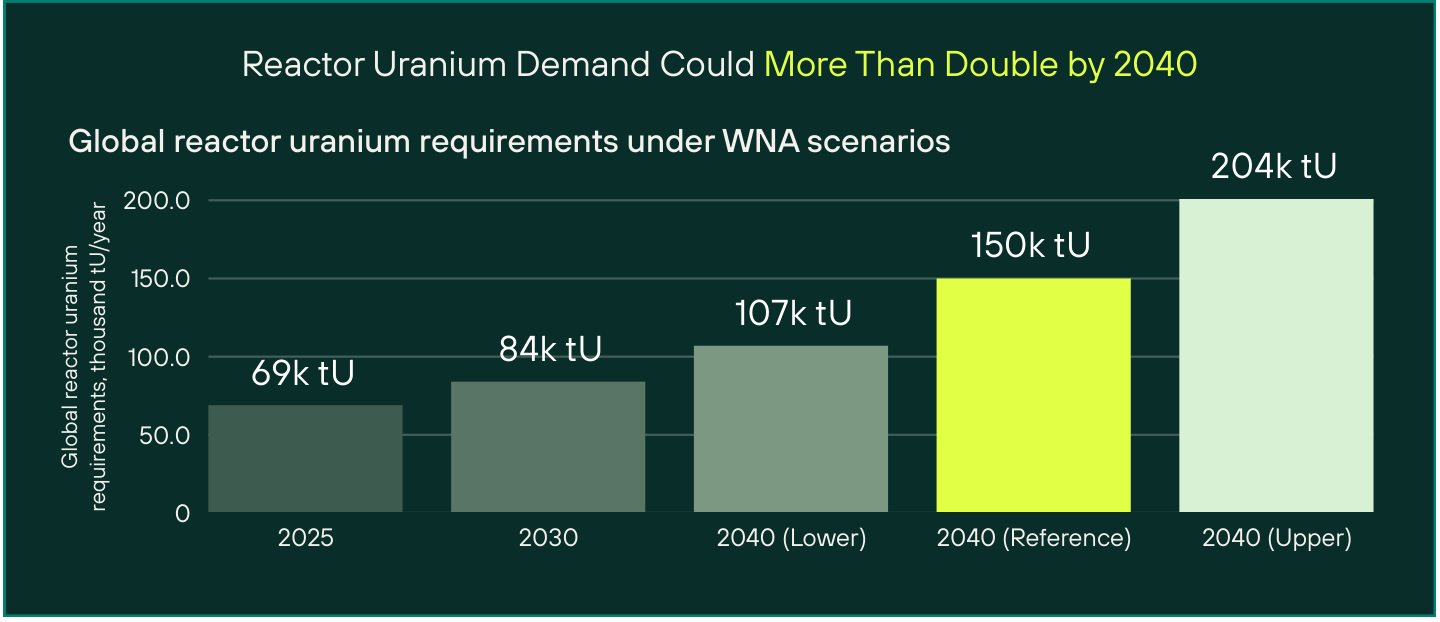
The uranium market is becoming increasingly dependent on primary mine supply, which now meets roughly 90% of reactor demand compared with 78% in 2022.14 As secondary sources decline, the market is more exposed to supply disruptions, while new mine development remains slow and challenging. This growing gap between demand and supply growth underscores the strategic value of tier-one uranium assets in stable, predictable jurisdictions.
A Different Investment Question: Who Can Meet Our Energy Needs?
Taken together, these forces are changing the calculus for energy and materials markets. For much of the past two decades, competitiveness was largely defined by cost: who could produce energy and critical resources most efficiently and at the lowest price. Cost remains fundamental, but a world requiring significantly more energy, infrastructure and strategic materials places greater value on another set of considerations. Reliability, security of supply, access to infrastructure and geopolitical stability increasingly matter alongside economics.
For investors, that changes the question. It is no longer simply who can produce energy and strategic materials at the lowest cost. It is which regions can reliably meet more of their own energy and strategic-resource needs at scale, while offering the political stability, regulatory framework and physical infrastructure necessary to support that production over decades.
Few regions are as well positioned to meet those requirements as North America. The continent combines an exceptional resource base spanning oil, natural gas, uranium, copper and other critical minerals with deep capital markets, established legal and regulatory frameworks, sophisticated operators and extensive infrastructure connecting production with domestic and global markets. These advantages are difficult to replicate individually and even harder to assemble within a single region.
North America therefore may offer something increasingly valuable in a more energy-intensive and geopolitically complex world: the ability to meet more of its own energy and strategic-resource needs within a large, integrated and dependable continental system. That combination — resource abundance plus the capacity to develop, transport and transform it — is the foundation of the investment case for greater North American energy independence.
Section 3
The North American Independence Advantage
North America’s advantage is not simply that it has energy and strategic resources in the ground. It has much of the infrastructure, expertise and capital required to turn those resources into usable energy and economic value within an integrated continental system. That combination becomes particularly important as North America seeks to meet rising demand while reducing dependence on vulnerable external supply chains.
Greater energy independence will require sustained investment across the system — from resource development and power generation to transportation, processing and the materials needed for electrification. Each layer depends on the others, creating a potential capital cycle across multiple industries.
North America offers substantial reserves of oil, natural gas, uranium and critical minerals that are supported by deep private capital markets, sophisticated operators, established legal and regulatory frameworks, and extensive networks of pipelines, transmission systems, railways, ports and processing infrastructure. The integration of the U.S. and Canadian energy systems further expands that advantage, connecting major resource basins with industrial centers, population hubs and global export markets.
In other words, the opportunity is not only what North America has in the ground, but its unusual ability to develop those resources and bring them to market at scale.
A. An Energy Superpower
Oil
North America’s energy advantage begins with the depth of its hydrocarbon resources. The United States and Canada, considered together, form the largest integrated oil- and gas-producing region on the planet and each country individually already ranks among the global leaders.
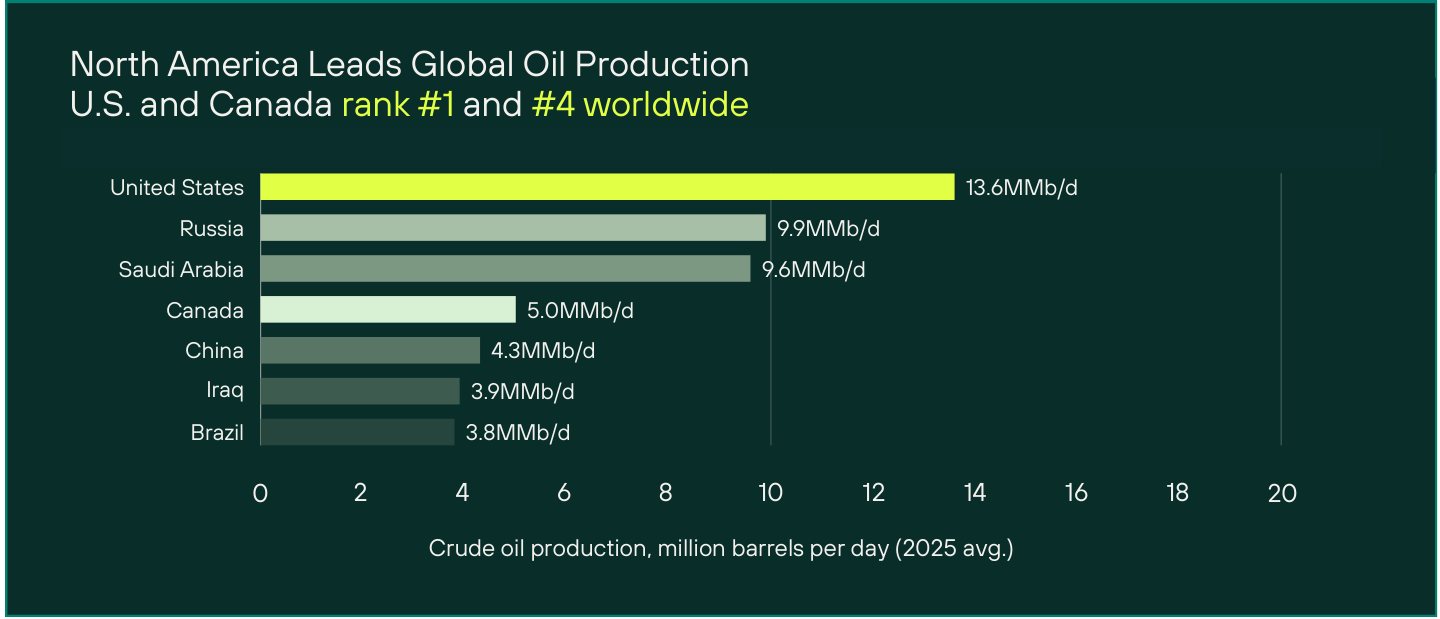
The United States is the world’s largest crude oil producer, a position it has held every year since 2018, when it overtook Russia. U.S. crude oil production, including lease condensate, averaged a record-high 13.6 million barrels per day (b/d) in 2025 (capturing roughly 15.8% of global crude output) and was roughly 40% higher than either of the next two largest producers, Russia and Saudi Arabia. The EIA forecasts production will remain near 13.7 million b/d in 2026 and rise above 14.2 million b/d in 2027, the first time U.S. output has ever exceeded that level.16
The engine behind that growth is the Permian Basin, spanning West Texas and southeastern New Mexico, which alone produced a record 6.6 million b/d in 2025, very close to half of total U.S. output, and grew 4% that year even as prices held near a relatively modest $65 per barrel WTI.17 That resilience matters: Permian breakeven costs for new wells have fallen into the $61–62 range, with top-tier acreage economic below $45, meaning the basin can keep growing at price levels that would have stalled U.S. shale a decade ago.17 Texas alone now accounts for roughly 42% of total U.S. crude production.18
Canada, meanwhile, is the world’s fourth-largest oil producer and fourth-largest holder of proven oil reserves, at roughly 163 billion barrels, trailing only Venezuela, Saudi Arabia, and Iran, and ahead of every OPEC member except those two.19 Canadian production reached a new high of roughly 5.6 million b/d in late 202520, with the province of Alberta alone standing as the world’s fourth-largest producing jurisdiction.19
Almost all of that reserve base, roughly 159 billion of Canada’s 163 billion barrels, or about 98%, sits in the Alberta oil sands, making the oil sands alone the world’s fourth-largest proven oil reserve as a single resource.21 The oil sands are not a marginal or speculative resource: they already supply more than 3.5 million b/d, or roughly 57–58% of Canada’s total oil production22, extracted through a mix of surface mining and in-situ steam-based methods such as SAGD. Production is forecast to keep growing at a modest pace, with one industry estimate projecting oil sands output reaching 3.6 million b/d by 2030.23
Combined, the United States and Canada now produce more crude oil than any other two countries on Earth, anchored by two of the most durable, technically advanced oil resources in the world: the Permian’s tight-oil formations and Alberta’s oil sands. Few regions combine that kind of scale with the infrastructure to keep developing it for decades to come.
Natural Gas
The pattern is equally evident in natural gas. The United States has been the world’s largest natural gas producer every year since 2009 and is on track to set another production record in 2026.24 Output is expected to average 122.5 billion cubic feet per day (Bcf/d), up from the previous record of 118.5 Bcf/d set in 2025, led by production from the Permian, Haynesville and Appalachia basins.24 That abundance has also transformed the United States into the dominant force in global LNG (liquefied natural gas). As of September 2025, U.S. LNG terminals had a combined export capacity of 102.3 million tonnes per year, more than any other country.25 The rise has been remarkably swift.
The United States shipped its first LNG export cargo from Sabine Pass, Louisiana, in February 2016 and became a net natural gas exporter just three years later. By 2025, U.S. LNG exports had reached a record 111 million tonnes, making the United States the first country to surpass 100 million tonnes in a single year.26 That put U.S. exports roughly 20 million tonnes ahead of Qatar and accounted for approximately 93% of the growth in global LNG exports that year.26
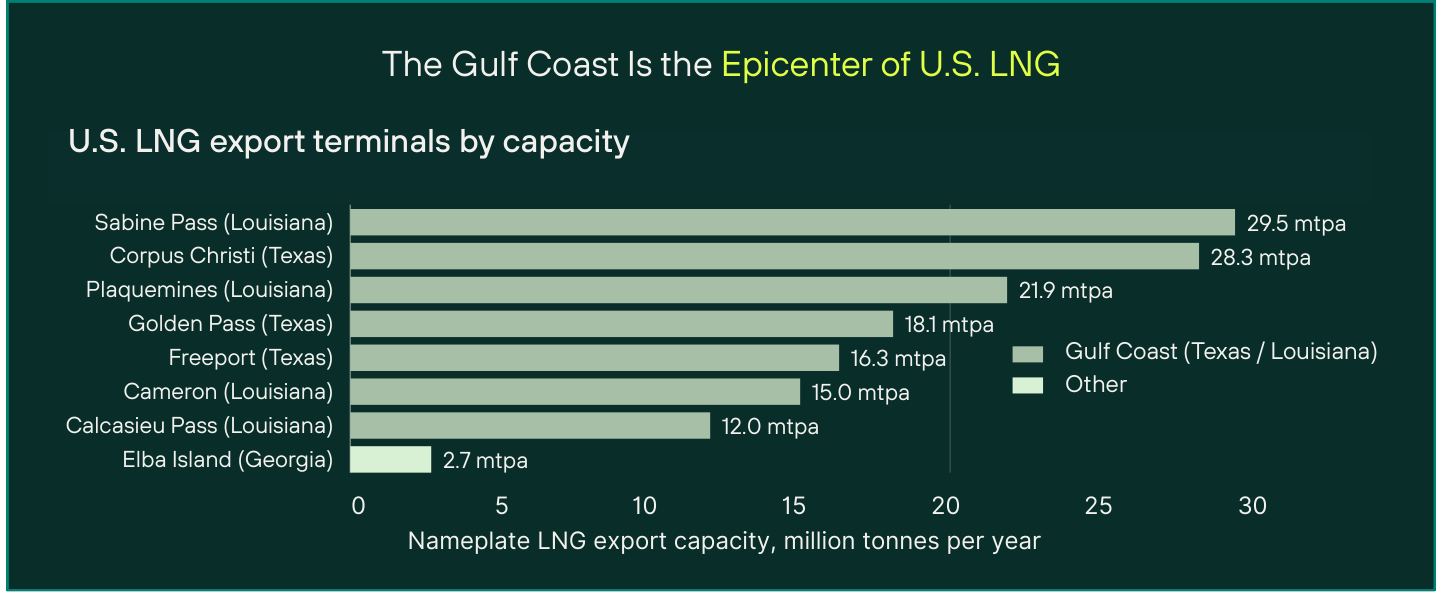
Much of this industry is concentrated along a relatively narrow stretch of the U.S. Gulf Coast. Of the eight LNG export terminals operating in the United States at the beginning of 2026, seven were located along the Texas and Louisiana coastline, supported by an extensive pipeline network connecting major producing regions with export facilities. The Whistler Pipeline, for example, carries Permian natural gas toward Corpus Christi, while the Gulf Run Pipeline connects Haynesville production with Louisiana’s LNG corridor.
The scale of this infrastructure continues to grow. Sabine Pass in Louisiana is the largest U.S. LNG export terminal, with nameplate capacity of roughly 29.5 million tonnes per year27, while Corpus Christi reached approximately 28.3 million tonnes following its Stage 3 expansion28. Plaquemines LNG, which shipped its first cargo in December 2024, expanded rapidly and accounted for more than 60% of the increase in global LNG supply during 2025, according to the IEA29. In April 2026, Golden Pass joined the network with its first cargo, becoming the ninth U.S. LNG export terminal and adding approximately 18 million tonnes of annual capacity.30
The buildout is far from complete. The EIA expects U.S. LNG export capacity to nearly double by 2031 from year-end 2025 levels, supported by projects already under construction, including Port Arthur LNG, Rio Grande LNG and additional expansions at existing facilities. Together, this growing network of pipelines and export terminals is strengthening the Gulf Coast’s role as the primary gateway connecting abundant U.S. natural gas production with global markets.
Europe has been the primary destination for this growing supply as the region continues to reduce its reliance on Russian pipeline gas following the 2022 invasion of Ukraine. U.S. LNG shipments to Europe reached a record 10.3 billion cubic feet per day in 2025, up from 6.3 billion just one year earlier. The combination of abundant supply, flexible export capacity and growing demand for diversified sources has strengthened the strategic importance of U.S. LNG in global energy markets.31
Canada’s natural gas resource is another major component of North America’s energy advantage. Concentrated largely in the Western Canadian Sedimentary Basin, Canadian production reached a record 18.8–19 Bcf/d in 2025, supported by prolific formations such as the Montney in British Columbia and Alberta.32 Historically, however, this abundant supply had limited access to markets beyond the U.S. pipeline network, contributing to persistent discounts for Canadian natural gas relative to U.S. benchmarks.
That began to change in June 2025, when LNG Canada shipped its first cargo from Kitimat, British Columbia. Canada’s first large-scale LNG export facility provides direct Pacific access to North Asia, with shipping times of roughly 10 days. Its location also provides a route to major Asian markets without relying on maritime chokepoints such as the Strait of Hormuz or Panama Canal. Phase 1 provides 14 million tonnes of annual capacity, with a potential expansion that would double capacity to approximately 28 million tonnes.33
The significance extends beyond a single LNG facility. Pacific export capacity is opening global markets to one of North America’s largest natural gas resources, potentially strengthening the economics of western Canadian production while diversifying the continent’s export infrastructure. As geopolitical disruptions continue to underscore the value of secure and geographically diversified energy supply, Canada’s combination of abundant natural gas, established pipeline infrastructure and direct Pacific access adds another strategically important asset to the broader North American energy system.
Hydroelectricity
Hydroelectricity adds another dimension, providing the continent with a substantial base of established, large-scale power generation. In 2025, hydro generated approximately 343 TWh of electricity in Canada, accounting for 54.9% of the country’s total generation even amid persistent drought conditions. Major hydroelectric systems in Quebec, British Columbia, Manitoba, Newfoundland and Labrador, and Ontario form the backbone of that capacity.34
The United States adds significant hydroelectric resources of its own. In 2025, the country had approximately 80 GW of conventional hydroelectric capacity, generating roughly 247 TWh of electricity, or about 6% of total U.S. utility-scale generation.35 The United States also had approximately 23 GW of pumped-storage hydropower capacity across 18 states.35
The strategic value of these assets extends beyond the electricity they generate. Many reservoir-based hydro facilities can adjust output as grid conditions change, providing flexibility as power systems absorb greater amounts of variable generation and contend with larger and less predictable loads. Pumped-storage hydropower adds another layer of flexibility by storing energy when supply is abundant and returning it to the grid when needed. The U.S. Department of Energy has identified these capabilities as increasingly important for balancing electricity grids, supporting reliability and integrating variable resources such as wind and solar.
The strength of North America’s hydroelectric base is further enhanced by the integration of the Canadian and U.S. power systems. The two countries are connected by 86 international power transmission lines, allowing electricity to move across the border as regional supply and demand conditions change. In 2025, Canada supplied 81.3% of all electricity imported by the United States.36 Together, domestic hydroelectric capacity and cross-border transmission provide another source of flexibility within a continental power system facing rising electricity demand.36
Infrastructure
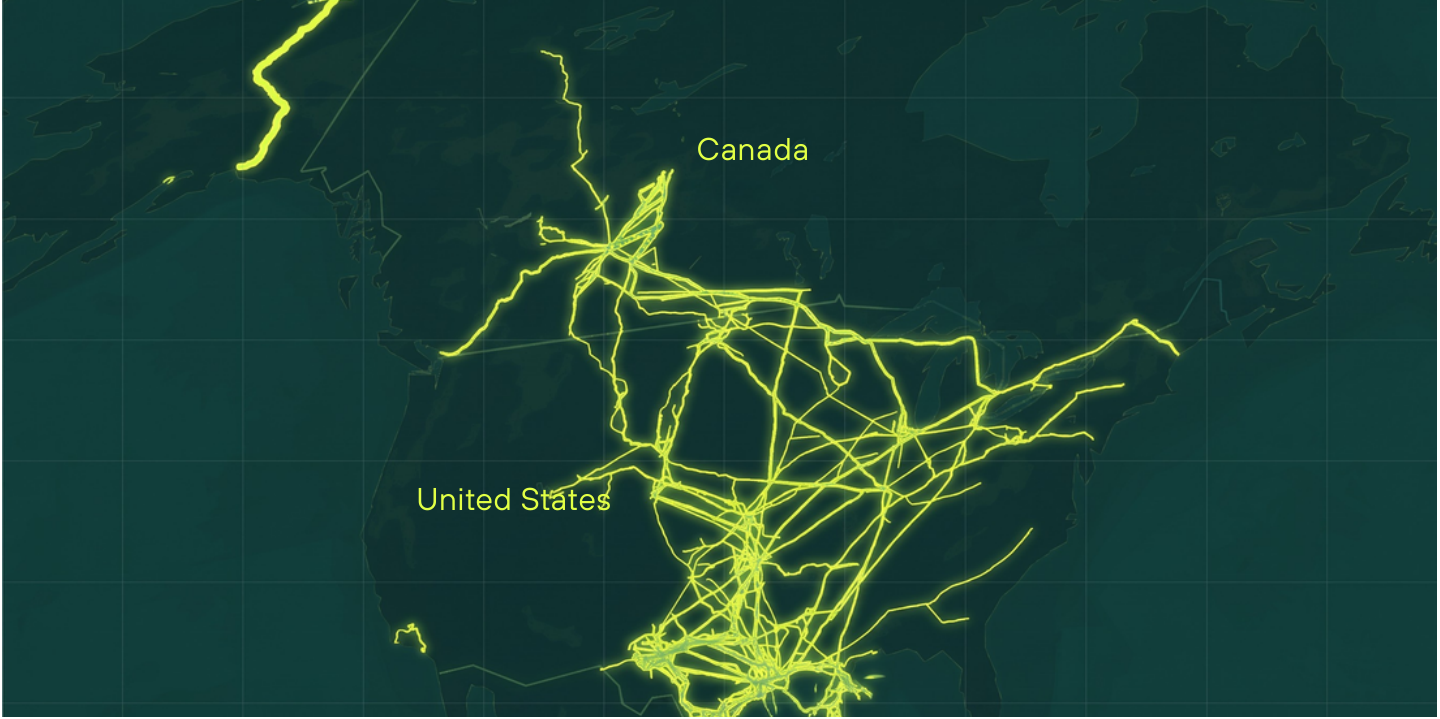
North American pipelines represent an extraordinary collection of strategic assets. The scale is difficult to overstate. The United States alone operates millions of miles of energy pipelines, including approximately 300,000 miles of natural gas transmission lines and nearly 2.4 million miles of distribution mains and service lines. This vast network connects producing regions such as the Permian, Haynesville and Appalachia basins with power plants, industrial centers, population hubs and, increasingly, LNG export terminals along the Gulf Coast. Nearly all U.S. intrastate natural gas pipeline capacity added in 2023 was concentrated in Texas and Louisiana, much of it built to serve growing Gulf Coast demand, including LNG exports.
The continent’s crude oil infrastructure is similarly extensive. Few systems illustrate its strategic importance better than the Enbridge Mainline, part of the longest and most complex crude oil and liquids pipeline network in North America. Enbridge’s broader liquids system spans more than 18,000 miles, transports roughly 30% of the crude oil produced in the United States and Canada, carries approximately 70% of Canadian crude exports bound for the United States and connects with roughly 75% of North American refining capacity.37 In 2025, the system delivered a record 4.99 billion barrels of oil.37 With Western Canadian production continuing to grow, Enbridge is advancing a $1.4 billion optimization program designed to add 150,000 barrels per day of Mainline capacity, with further expansion under consideration.37
The Mainline operates alongside other major systems, including Keystone and Trans Mountain, that provide Western Canadian producers with access to U.S. and global markets. Within the United States, extensive crude oil, refined-product and natural gas networks connect major producing basins with some of the world’s largest refining, petrochemical and LNG export hubs. Together, these systems form the physical connective tissue of the North American energy market, allowing oil and natural gas to move across borders and from producing regions to domestic and global consumers.
Built over decades and extraordinarily difficult to replicate, this infrastructure represents more than a means of transportation. It is what converts North America’s resource abundance into deliverable energy supply, connecting production with demand and reinforcing the economic value of the resources flowing through it.
B. Canada Completes the North American Energy Independence Story
Discussions of American energy independence often focus on the United States in isolation. That misses a defining advantage: the United States already sits within a deeply integrated continental energy system. Canada, its largest geographic neighbor and one of its most important energy partners, substantially broadens the resource base available to North America. Decades of cross-border investment and infrastructure development have connected the two countries through pipelines, transmission systems, railways and trade relationships that already function across national boundaries.
The strengths of the two countries are highly complementary. The United States brings enormous energy production, the world’s largest energy demand base, deep capital markets, technological leadership, substantial refining capacity, LNG infrastructure and the world’s largest power markets. Canada adds extraordinary oil reserves, abundant natural gas and hydroelectricity, some of the world’s highest-grade uranium deposits, and a critical-minerals endowment spanning potash, nickel, copper, cobalt and more, supported by established pipeline and export infrastructure.
Together, these capabilities create a continental energy system with a breadth of resources, infrastructure, capital and market access that could be difficult for any region in the world to replicate.
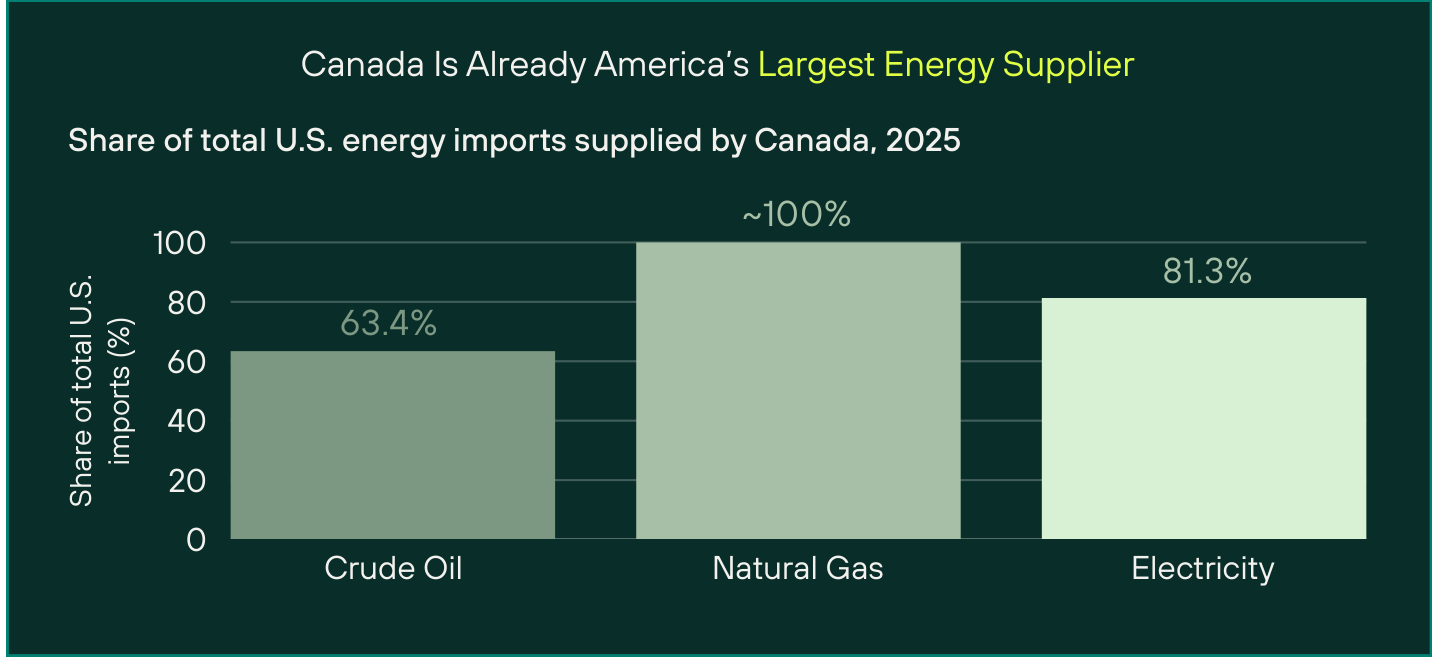
The depth of this integration is evident in the flow of energy across the border. In 2025, Canada supplied 63.4% of all U.S. crude oil imports38, roughly nine times the volume supplied by Mexico39, the next-largest source. Canada also accounted for close to 100% of U.S. natural gas imports and 81.3% of imported electricity.38 Underpinning these flows is an extensive network of cross-border pipelines and 86 international power transmission lines that physically connect the two countries’ energy systems.
For investors, the strategic point is simple: America does not have to pursue energy independence alone. Its largest energy partner is already connected immediately to the north.
Importantly, this relationship runs in both directions. The United States remains Canada’s largest customer while also supplying roughly 84% of Canada’s hydrocarbon imports36, including refined products serving regions that are not connected to Canada’s domestic pipeline networks. The result is an energy relationship defined by physical integration and mutual dependence rather than trade flows alone.
The Clearest Example: Uranium
Few areas illustrate the North American advantage more clearly than uranium. Rising global demand is increasing the strategic importance of fuel supply, while the concentration of uranium production and fuel-cycle capacity in a relatively small number of countries has made jurisdiction increasingly important. North America enters this environment with one of the world’s most strategically important uranium resource bases anchored by exceptionally high-grade Canadian deposits, established operators and fuel-cycle infrastructure within a politically secure allied jurisdiction.
At the center of that resource base is northern Saskatchewan’s Athabasca Basin. The region hosts the world’s largest high-grade uranium deposit, McArthur River, and the world’s second-largest, Cigar Lake, together with Key Lake, the world’s largest uranium mill. Ore grades in the Athabasca Basin can run up to 100 times the global average, and ten of the world’s fifteen highest-grade uranium deposits are found there.40 The basin accounts for roughly 15% of global uranium mine production, helping make Canada the world’s second-largest producer behind Kazakhstan.41 Cameco Corporation, headquartered in Saskatoon, operates much of that production and is one of the largest publicly traded uranium companies in the world.
Canada’s advantage also extends beyond the mine. Uranium produced in Saskatchewan can move through additional stages of the nuclear fuel cycle within Canada, including refining at Blind River and conversion at Port Hope, Ontario. In 2025, Cameco’s fuel-services operations produced 14.0 million kgU, including a record 11.2 million kgU of uranium hexafluoride (UF₆) at Port Hope.42 Strong demand for Western conversion capacity has also supported new long-term contracts, bringing Cameco’s contracted UF₆ conversion volumes to approximately 83 million kgU. For Canada’s CANDU fleet, uranium dioxide produced at Port Hope can continue into domestic fuel fabrication, while UF₆ destined for light-water reactors is exported for enrichment and subsequent fuel fabrication.
The importance of this resource and processing base becomes even more pronounced when viewed through the lens of supply security. Kazakhstan controls roughly 40% of global uranium mine supply41, more than double Canada’s share. Its uranium sector, however, remains deeply intertwined with Russia. Rosatom-linked entities hold significant equity stakes across Kazakh uranium joint ventures, while Russia controls a substantial share of the world’s uranium conversion and enrichment capacity. As a result, even uranium mined outside Russia can depend on Russian infrastructure before becoming reactor-ready fuel.
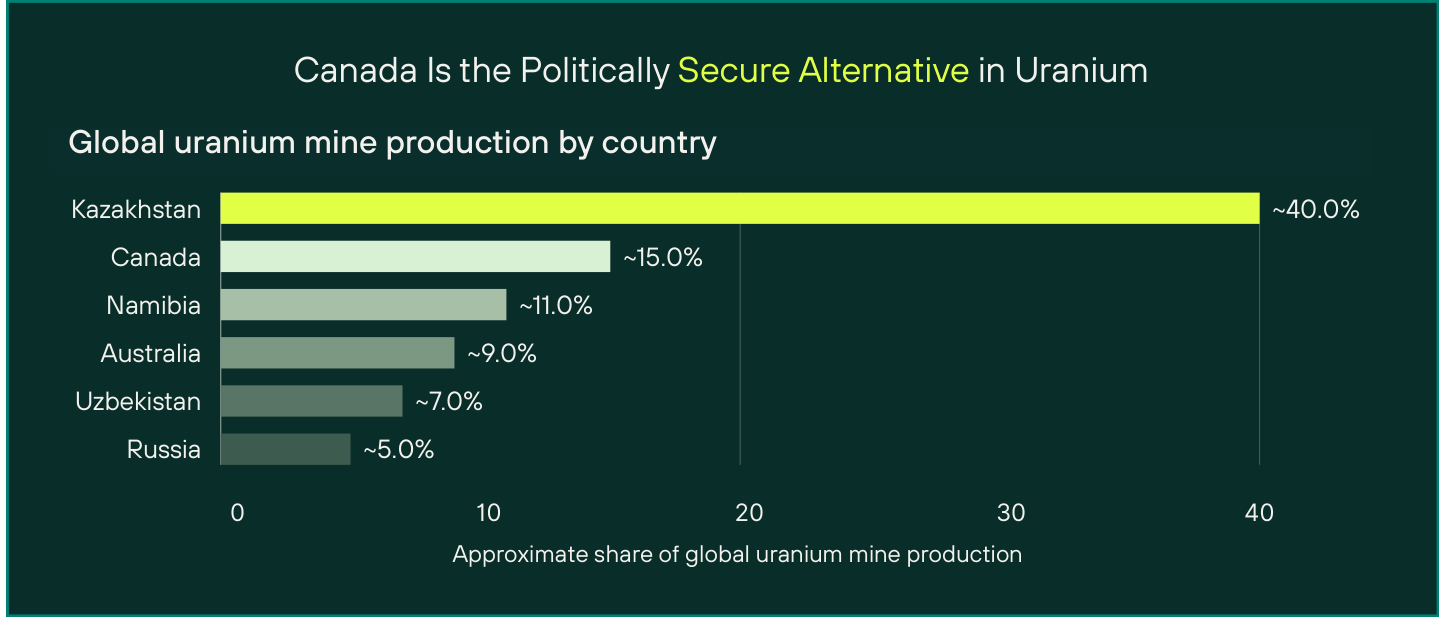
That concentration has already contributed to supply friction. Kazatomprom, the world’s largest uranium producer, cut its 2026 production guidance by roughly 10% in 2025, citing supply-chain and input constraints. Against that backdrop, Canadian uranium offers a more politically dependable foundation for North America’s nuclear fuel supply. From mining and milling in Saskatchewan to refining and conversion in Ontario, Canada controls several critical stages of the uranium fuel cycle within an allied jurisdiction, strengthening North America’s access to a secure and established source of nuclear fuel.
Reliable Baseload Power
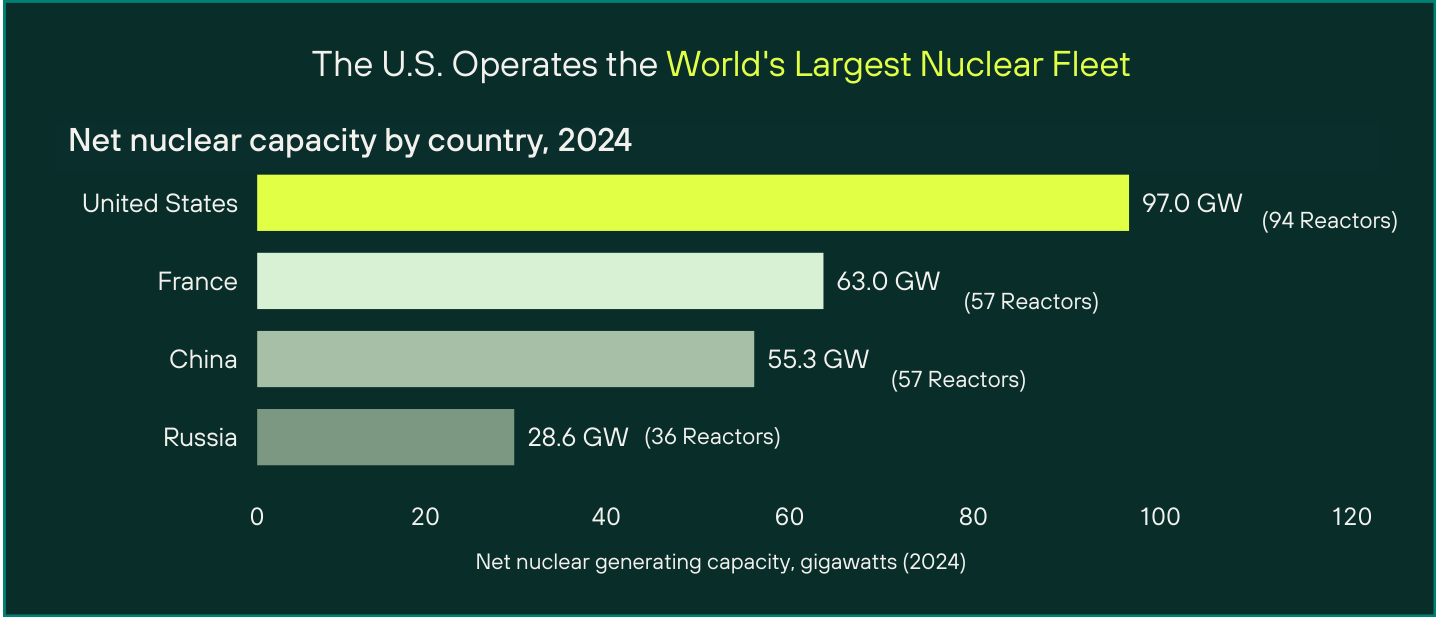
The uranium advantage feeds directly into a broader nuclear generation advantage. The United States operates the world’s largest commercial nuclear fleet encompassing 94 reactors with nearly 97 gigawatts of net capacity, supplying about 19% of U.S. electricity generation, well ahead of France (57 reactors, 63 GW) and China (57 reactors, 55.3 GW).43 Canada’s contribution is smaller in absolute terms but disproportionately important: Ontario’s Bruce Nuclear Generating Station, on the shore of Lake Huron, is among the largest operating nuclear power facilities in the world by generating capacity, with eight reactors and roughly 6,288 megawatts of output.44 Ontario’s broader CANDU reactor fleet, together with an emerging small modular reactor (SMR) ecosystem being developed on both sides of the border, gives North America a depth of nuclear operating expertise that few regions can match. This is precisely the dispatchable, carbon-free power source utilities and hyperscale data-center operators are increasingly turning to for firm, 24/7 electricity.
The Materials Behind the Next Energy System
The final component advantage lies in critical minerals, the physical inputs required to build and maintain an increasingly electrified economy. Copper carries electricity through transmission lines, transformers, data centers and industrial equipment. Nickel, cobalt and lithium are important inputs across batteries and advanced manufacturing, while rare earth elements are essential to permanent magnets used in electric motors, power generation, electronics and defense applications. Potash adds another dimension to the continent’s strategic resource base, linking mineral security with global food security.
Saskatchewan occupies an unusually important position within this landscape. The province contains 27 of Canada’s 34 designated critical minerals and is already a global leader in both uranium and potash.
Potash refers broadly to potassium-bearing salts, most commonly potassium chloride, that are mined and processed primarily for use in fertilizer. Potassium is one of the three essential macronutrients in commercial fertilizers, alongside nitrogen and phosphorus, making potash a critical input in agricultural productivity and global food production. Canada produced roughly 31% of the world’s potash in 2024, making it the largest producer globally, while Saskatchewan holds approximately 45% of known global reserves and is home to all of Canada’s operating potash mines.45
Saskatchewan’s mineral opportunity is also broadening beyond its established potash and uranium industries. Copper, zinc and lithium projects are moving toward commercial production, while the province is developing domestic rare earth processing capabilities. The McIlvenna Bay project is expected to bring commercial-scale copper and zinc production back to Saskatchewan, while emerging lithium projects are targeting the province’s subsurface brine resources. The Saskatchewan Research Council is also developing a commercial-scale rare earth processing and metals facility in Saskatoon, creating infrastructure intended to move the province further downstream from resource extraction into separation, processing and metallization.
The opportunity extends across Canada. Ontario, Quebec, Newfoundland and Labrador, and Manitoba together form an established nickel and cobalt production base. Canada produced approximately 125,000 tonnes of nickel in 2024, ranking fourth globally, with Ontario accounting for roughly 40% of domestic production.46 The country also produced approximately 3,350 tonnes of cobalt, much of it as a by-product of nickel mining.47 Operations in regions such as Ontario’s Sudbury Basin and Newfoundland and Labrador contribute to a domestic supply of metals used across stainless steel, batteries, aerospace, advanced manufacturing and other strategic industries.
These resources take on greater significance because the global supply chain remains highly concentrated. The challenge extends well beyond where minerals are mined to where they are refined and processed into usable materials. As demand from power infrastructure, data centers, advanced manufacturing, transportation and defense grows, the ability to mine, process and secure critical materials within the United States, Canada and allied supply chains could become an increasingly important strategic advantage.
C. The North American Energy Advantage, in One System
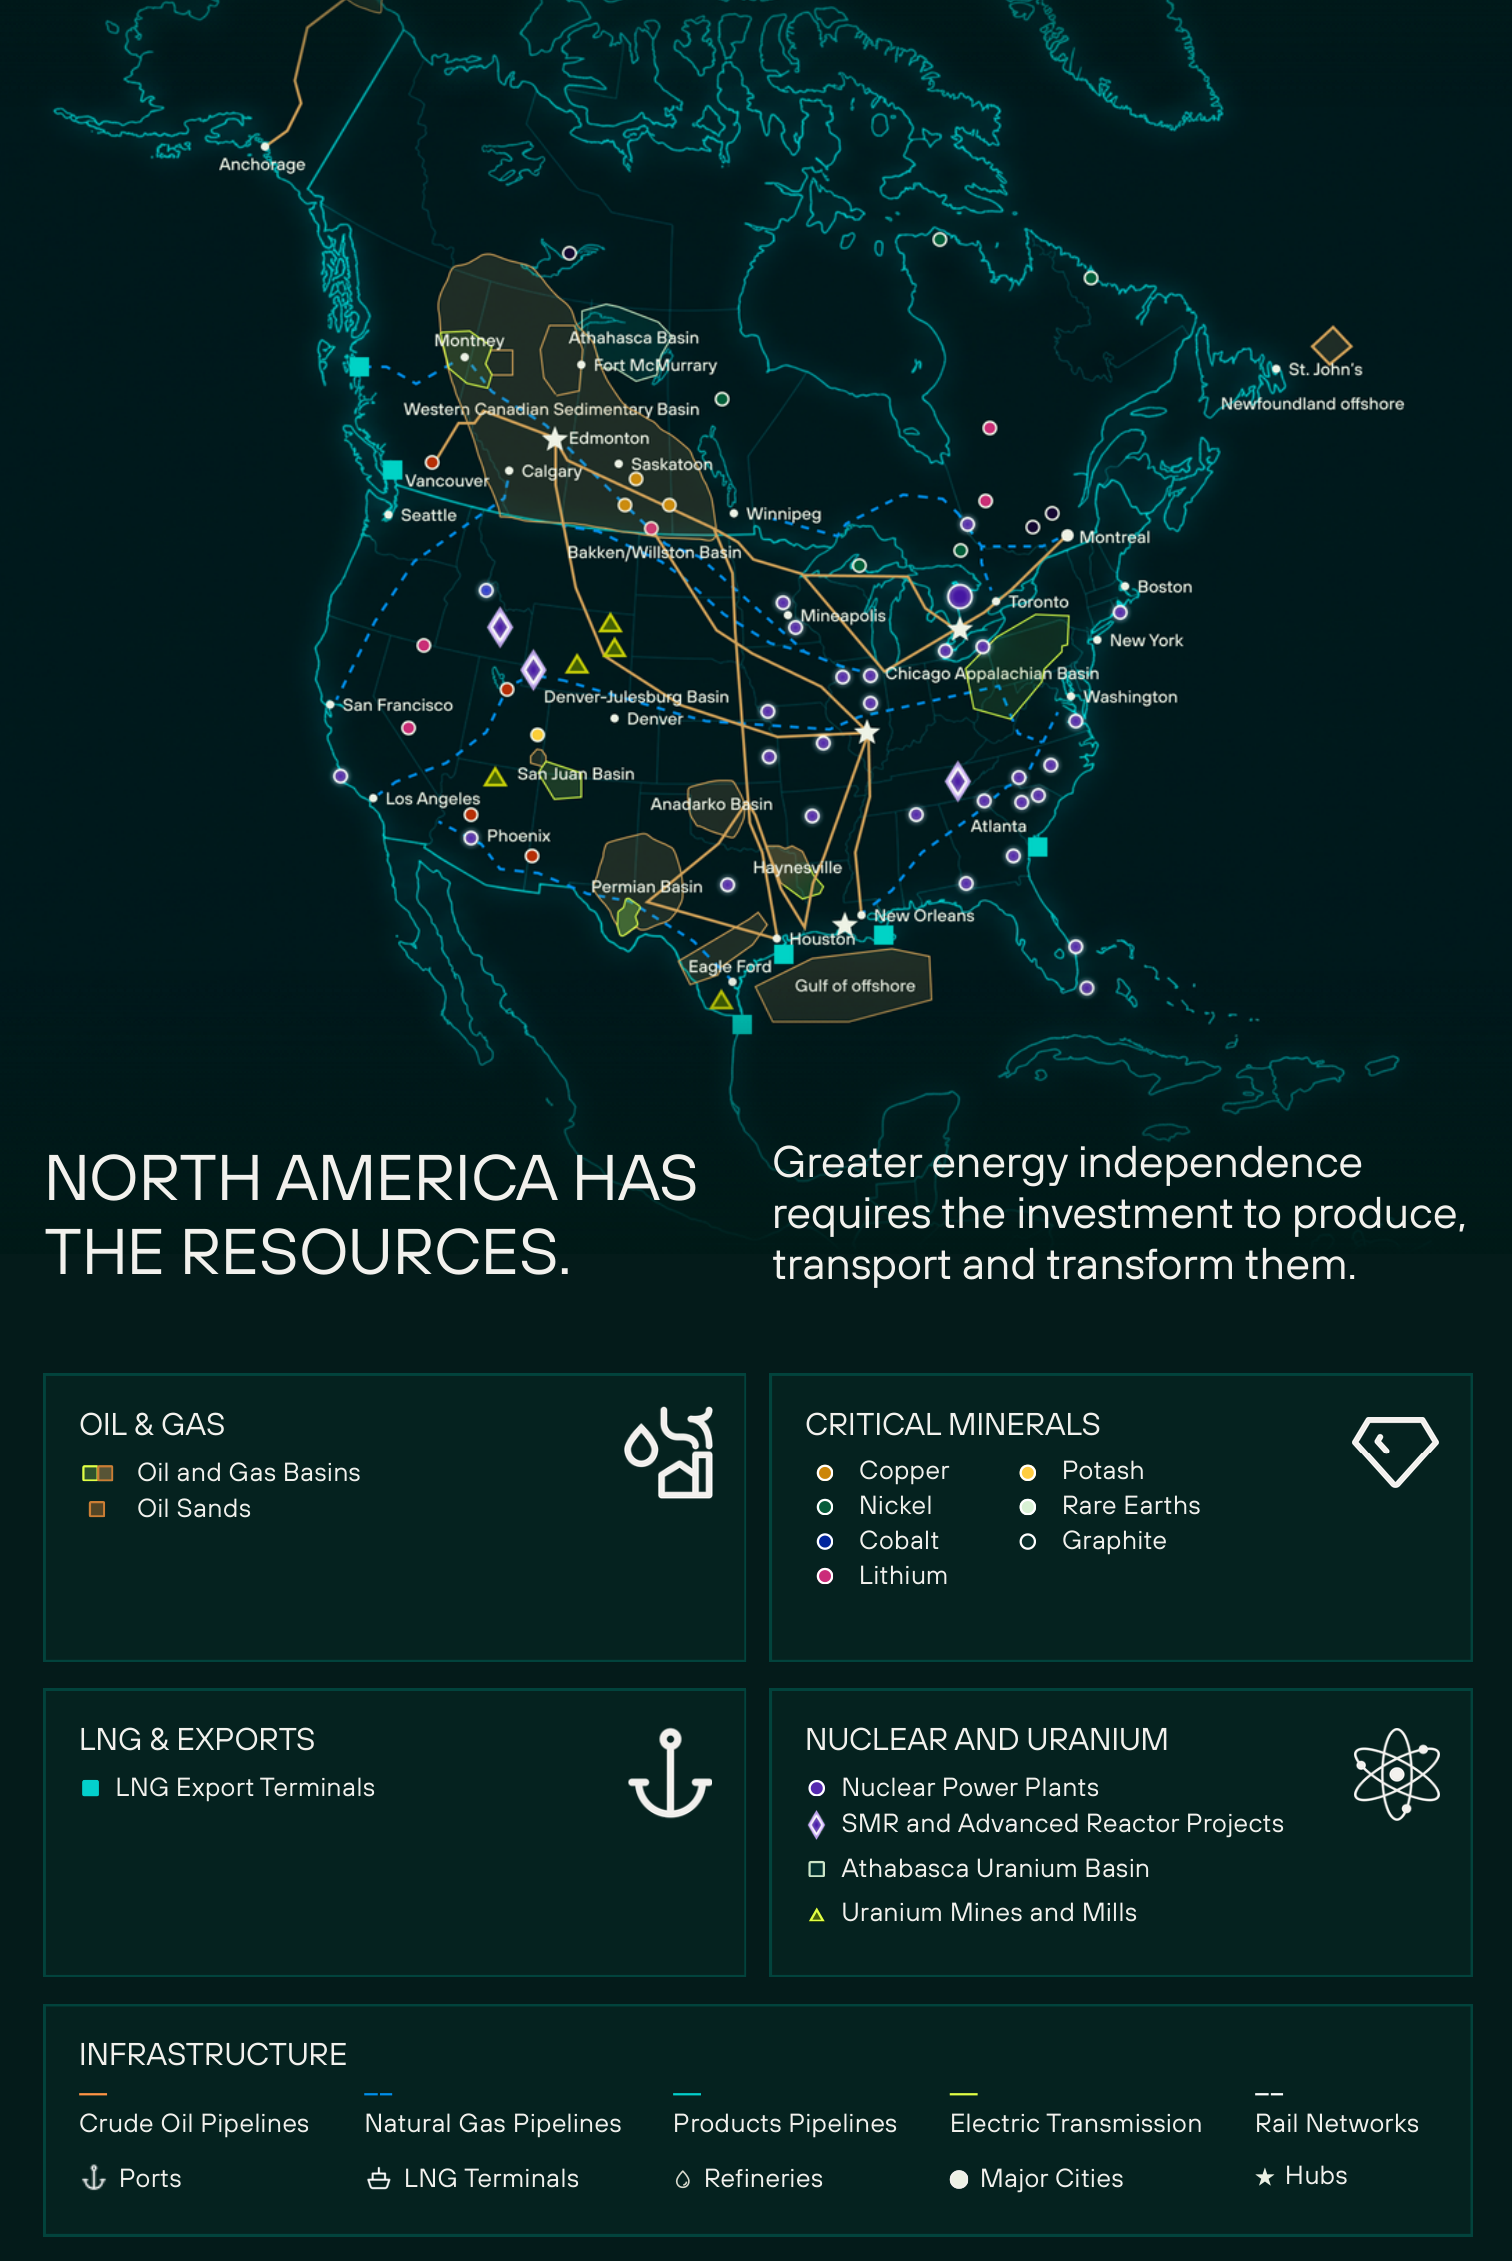
Taken together, these resources and capabilities create a potential investment opportunity that extends across the North American energy system. Meeting the continent’s growing needs while strengthening energy independence will require substantial capital across the companies that produce energy and strategic materials, transport them across North America, provide reliable power and supply the physical inputs required for continued expansion. The opportunity is therefore not a single commodity trade; it is participation in the buildout of a more self-sufficient continental energy system. ENRG is designed to invest across that opportunity.

Oil & Gas
Permian • Bakken • Gulf Coast • Western Canadian Sedimentary Basin • Alberta Oil Sands

LNG & Exports
U.S. Gulf Coast • U.S. Atlantic Coast • Western Canada (Kitimat, B.C.)

Nuclear & Uranium
Athabasca Basin • Ontario’s CANDU Fleet • U.S. Reactor Fleet • Emerging SMR Ecosystem

Critical Minerals
Copper • Uranium • Nickel • Potash • Cobalt • Broader Critical-Minerals Basket

Infrastructure
Integrated Canada–U.S. Pipelines • Cross-Border Transmission • Rail • Ports • Refineries • LNG Terminals • Hydroelectricity
The investment case for North American energy independence reflects the convergence of three structural forces. Demand is rising as artificial intelligence, data centers, electrification, industrial reshoring and economic growth increase the amount of energy North America must produce and deliver. Dependence is becoming more consequential as geopolitical fragmentation and concentrated supply chains increase the value of secure, reliable and politically dependable sources of energy and critical materials. Advantage increasingly rests with regions that possess both the resources to meet more of their own needs and the capital, infrastructure and expertise required to develop them.
Together, these attributes give North America an extraordinary collection of strategic assets across the energy system. The investment opportunity lies in the companies positioned to convert those advantages into economic value by producing and transporting energy, generating reliable power and supplying the materials required to expand the system itself.
Section 4
ENRG: Investing in North American Energy Independence
Energy Independence Requires the Full Energy System
Energy independence cannot be achieved through a single industry or commodity. Resources must be discovered and developed. Oil and natural gas must move from producing basins to refineries, power plants, industrial users and export terminals. Electricity must be generated reliably as demand grows. And expanding the entire system requires substantial quantities of copper, uranium and other strategic materials. These activities are economically distinct, but they are also deeply interconnected. Greater power demand can require additional generation. Additional generation can require more fuel and infrastructure. Expanding grids and data centers can increase demand for copper and other critical materials. Growing LNG exports can increase the value of natural gas production and the pipelines connecting producing basins with the coast. Investment in one part of the system can therefore create demand and opportunity elsewhere in the value chain.
That interdependence provides the foundation for the Fund’s (NYSE Arca: ENRG) portfolio architecture: energy independence requires investment across the system, not simply greater production of a single fuel.
Most energy ETFs capture one piece of the system. ENRG is designed to invest across the interconnected companies positioned to contribute to greater North American energy independence.
Rather than concentrating the portfolio around a single segment of the energy market, ENRG organizes the North American opportunity across four integrated pillars:

| Pillar | What It Captures | Role in the System |
|---|---|---|
| Energy Supply | Oil & gas producers | The base load of hydrocarbon production — the fuel that still underpins roughly 80% of global primary energy use today |
| Energy Transport | Pipelines & infrastructure | The physical connective tissue that moves molecules from basin to burner tip, and increasingly, to LNG export docks |
| Reliable Baseload Power | Nuclear & uranium | The dispatchable, carbon-free power source utilities and hyperscalers are turning to for firm, 24/7 electricity |
| Electrification Inputs | Copper & critical minerals | The materials that build the grid, the data center, and every electrified system layered on top of it |
The four-pillar structure reflects what greater energy independence requires in practice. Energy resources must be produced and transported, rising electricity demand must be met with reliable generation, and expanding power, transmission and end-use infrastructure requires strategic materials. Each pillar serves a distinct function, but activity within one can also create demand across the others.
This integrated structure defines the Fund’s (NYSE Arca: ENRG) investment universe. It includes companies involved directly or indirectly in the exploration, development, production and distribution of oil, natural gas, coal and uranium; the mining and processing of critical minerals used in electrification and grid development; and the power-generation and infrastructure assets that connect resources with end markets. Appendix A, “The Framework Behind the Portfolio,” illustrates how these interconnected segments are organized within the Fund’s (NYSE Arca: ENRG) investment approach.
Within this universe, Ninepoint’s proprietary scoring methodology evaluates and ranks companies according to their North American economic exposure, strategic importance and reliability. The resulting scores inform security selection and portfolio construction alongside issuer fundamentals, valuations, market conditions, portfolio weightings and other relevant factors. Holdings are monitored on an ongoing basis, with the portfolio reviewed for potential reallocation at least weekly and expected to be reviewed and rebalanced at least quarterly.
Together, these elements create a portfolio framework organized around the energy system as a whole, rather than a single outlook for a commodity, technology or source of generation. Traditional energy allocations often capture only one part of this broader opportunity, requiring investors to combine separate exposures to energy production, infrastructure, nuclear and uranium, and critical minerals. The Fund (NYSE Arca: ENRG) seeks to bring these interconnected segments together within a single, purpose-built portfolio.
Fund Details
| Field | Detail |
|---|---|
| Ticker | ENRG |
| Exchange | NYSE Arca |
| Structure | Exchange-traded fund |
| Sub-Adviser | Ninepoint Partners LP |
| Investment Advisor | Tidal Investments LLC |
| Expense Ratio | 0.65% |
| Portfolio Review | Ongoing monitoring; potential reallocation reviewed at least weekly; expected review and rebalance at least quarterly |
| Portfolio | Generally 25-50 equity securities |
| Geographic Focus | North America (Canada, Mexico and the United States); up to 10% outside North America. |
| Market Capitalization | Generally, at least $5 billion |
Investors are encouraged to view full fund details, download the current factsheet and marketing materials, and contact the Ninepoint distribution team with questions at www.NinepointETFs.com.
Section 5
Investment Framework & Sector-Specific Analysis
The Fund’s (NYSE Arca: ENRG) investment process combines Ninepoint’s proprietary scoring framework with sector-specific analysis across energy, mining and infrastructure. The framework assesses issuers using three primary criteria – North American Exposure, Strategic Importance and Reliability – while sector-specific analysis reflects the different economics of upstream producers, midstream infrastructure, nuclear and uranium, critical minerals and other energy sources. The Fund will generally invest in companies with at least $5 billion in market capitalization. The resulting scores inform security selection and portfolio construction rather than mechanically determining portfolio holdings or weights.
Why Sector-Specific Analysis Matters
ENRG aims to span businesses with very different economics, capital cycles and risk profiles, from upstream producers and pipelines to uranium companies, nuclear assets and critical-mineral businesses. The same measures of quality, durability and value cannot be applied identically across every segment. ENRG therefore combines a common scoring framework with sector-specific analysis appropriate to the different businesses that make up the North American energy system.
Portfolio Construction Discipline
Portfolio construction combines the proprietary scoring framework with fundamental research, valuation analysis, market conditions, risk considerations and portfolio constraints. These factors inform security selection, position sizing and portfolio reallocation.

1. Evaluate
Apply the Fund’s (NYSE Arca: ENRG) framework to assess North American exposure, strategic importance, and reliability for each candidate company.

2. Rank & Select
Use scoring outcomes together with fundamental research, valuation analysis, market conditions and portfolio considerations to identify compelling candidates and determine position sizes within and across categories.

3. Diversify
Manage exposure across sector, subsector, and issuer constraints so the portfolio reflects the energy system rather than a single commodity, industry, market segment or company.

4. Size
Set position weights based on scoring outcomes, relevance, risk and portfolio constraints.

5. Ongoing Monitoring & Reallocation
Energy markets are cyclical, capital-intensive and composed of businesses with very different economics. ENRG combines a consistent scoring framework with fundamental research, valuation discipline and ongoing monitoring. Holdings are monitored on an ongoing basis, the portfolio is reviewed for potential reallocation at least weekly, and the Sub-Adviser expects to review and rebalance the portfolio at least quarterly. Positions may be added, removed, substituted or rebalanced as relevant factors change.
Anticipated Portfolio
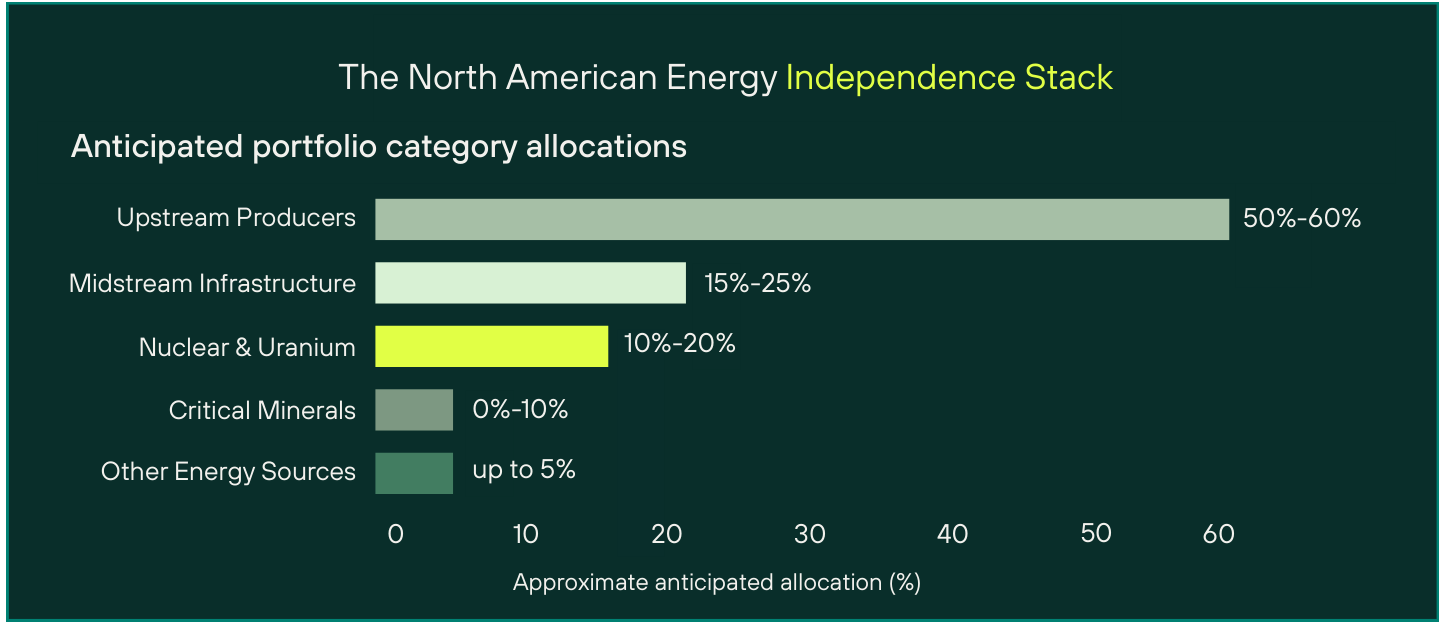
Illustrative initial portfolio category allocations based on the final prospectus: Upstream Producers ~50%–60%; Midstream Infrastructure ~15%–25%; Nuclear & Uranium ~10%–20%; Critical Minerals ~0%–10%; Other Energy Sources up to 5%. These are current expectations and guidelines only; actual allocations may vary over time.
The prospectus anticipates five initial portfolio categories: Upstream Producers (approximately 50%–60%), Midstream Infrastructure (approximately 15%–25%), Nuclear & Uranium (approximately 10%–20%), Critical Minerals (approximately 0%–10%), and Other Energy Sources (up to 5%). These allocations are guidelines only and may change as investment conditions and portfolio considerations evolve. The Fund may also hold cash, cash equivalents and short-term U.S. government securities when sufficient compelling opportunities are not identified, and it uses forward foreign currency contracts to seek to hedge foreign-currency investments back to U.S. dollars.
Anticipated Portfolio Attributes
- The Fund’s portfolio will generally be comprised of between 25 and 50 equity securities. The Fund is considered non-diversified under the Investment Company Act of 1940 and will invest more than 25% of its assets in the energy group of industries.
- The Fund will generally invest in companies with at least $5 billion in market capitalization.
- The Fund focuses on North America, defined as Canada, Mexico and the United States. The Fund may invest up to 10% of its assets, without regard to geographic location, in companies economically tied to countries outside North America.
Under normal circumstances, at least 80% of net assets plus borrowings for investment purposes will be invested in securities of North American Energy Companies. For this purpose, a North American Energy Company is economically tied to Canada, Mexico or the United States and derives at least 50% of its revenue or book value from qualifying energy activities, including exploration, development, production and/or distribution of oil, gas, coal or uranium, power generation, energy-system inputs, and energy services and infrastructure.
The Sub-Adviser monitors portfolio holdings on an ongoing basis, reviews the portfolio for potential reallocation at least weekly, and expects to review and rebalance the portfolio at least quarterly. Positions may be added, removed, substituted or rebalanced at any time.
ENRG may hold cash and cash equivalents and uses forward foreign currency contracts to seek to hedge foreign-currency risk.
Together, these parameters are designed to keep the portfolio focused on the North American energy and resource opportunity while allowing holdings, weights and exposures to evolve in response to changing fundamentals, valuations, market conditions and investment opportunities. Actual portfolio composition may change over time, subject to the Fund’s governing prospectus.
Download the Full Investment Case
Appendix A
The Framework Behind the Portfolio
The Sub-Adviser’s proprietary scoring framework evaluates and ranks issuers based on their strategic alignment with the North American energy-independence thesis. The framework is built around three primary criteria:
- North American Exposure: the extent to which a company’s assets, earnings, reserves, and operations are economically tied to energy activity in Canada, Mexico, and/or the United States
- Strategic Importance: the significance of the company’s role within the North American energy system and value chain, including the scarcity or criticality of its assets
- Reliability: the stability, durability, and resilience of its operations, supply profile, and cash flows
In evaluating these criteria, the Sub-Adviser may consider quantitative and qualitative factors including revenue composition, asset quality, reserve characteristics, contract structures, balance-sheet strength and position within the energy value chain. Not every factor applies to every business. The resulting scores inform security selection and portfolio construction; they do not mechanically determine which securities are selected or their portfolio weights.
Upstream Producers – North American Exposure Score
| Factor | Examples of Factors Considered for Upstream Producers |
|---|---|
| North American exposure | Extent of North American production and reserves |
| Economics & durability | Cost competitiveness and ability to generate resilient and durable free cash flow |
| Financial quality | Balance-sheet strength and capital-allocation discipline |
Midstream Infrastructure – Energy Security Score
| Factor | Examples of Factors Considered for Midstream Infrastructure |
|---|---|
| North American exposure | Degree of North American revenue exposure |
| Strategic importance | Ownership of critical pipeline, storage and energy-transportation assets |
| Reliability | Stability of fee-based cash flows and balance-sheet strength |
| Balance sheet strength (leverage, funding model) | ~15% |
Nuclear & Uranium – Strategic Score
| Business Type | Examples of Factors Considered Within Nuclear & Uranium |
|---|---|
| Uranium producers | North American production and reserves; cost competitiveness; operating efficiency; resilient cash flows |
| Developers & explorers | North American resource exposure; expected capital intensity and project economics; quality and scale of resource assets |
| Nuclear supply chain | North American revenue exposure; position in nuclear fuel cycle/value chain; profitability characteristics; strategic importance |
| Asset quality and scarcity | ~15% |
Critical Minerals – Strategic Relevance Score
| Factor | Examples of Factors Considered for Critical Minerals |
|---|---|
| North American exposure | Extent of North American production, reserves and resource exposure |
| Economics & asset quality | Cost competitiveness; operating efficiency; development economics; capital intensity; quality of principal assets |
| Strategic importance | Importance of underlying minerals to North American energy independence, electrification and industrial supply chains |
| Asset quality and scarcity | ~20% |
These scores inform security selection and portfolio construction by measuring each company’s strategic alignment with the North American energy-independence thesis in a consistent, repeatable way.
Appendix B
The Energy Independence Gap: Why a Full-System Portfolio?
Energy Independence Requires More Than One Part of the System
Investors seeking exposure to the North American energy system are generally offered a collection of narrower strategies rather than a portfolio built around the system as a whole. Conventional energy funds have historically concentrated on oil and gas producers, integrated energy companies and refiners, providing limited exposure to areas such as nuclear energy, uranium and critical minerals. Newer energy-security and infrastructure strategies have broadened the opportunity set to include power generation, grid infrastructure and midstream assets. However, these strategies also tend to emphasize particular segments of the value chain.
As a result, the four essential components of greater North American energy independence — supply, transport, reliable power and strategic inputs — are not typically brought together within a single investment framework.
Building Broader Exposure Can Be Complex
Investors can attempt to recreate this broader exposure by combining specialized allocations to conventional energy, midstream infrastructure, nuclear and uranium, and critical materials. Doing so shifts responsibility for selecting, weighting and rebalancing those exposures to the investor, along with managing multiple funds, expense ratios and trading costs. More importantly, it requires maintaining a consistent approach to North American relevance, company quality and valuation across industries with fundamentally different economics and market cycles.
One Framework for Energy Independence
ENRG seeks to address this gap by bringing these interconnected segments together within a single portfolio. A common North American energy-independence framework provides consistency across the strategy, while sector-specific analysis reflects the different economics and investment characteristics of businesses across the energy system.
Appendix C
Sources
Primary Sources
- Canada Energy Regulator. “Market Snapshot: Overview of 2025 Canada-U.S. Energy Trade.” Last modified March 2026.
- U.S. Energy Information Administration. Short-Term Energy Outlook. September 2025.
- U.S. Energy Information Administration. Short-Term Energy Outlook. January 2026.
- U.S. Energy Information Administration. “Data Center Server Energy Use Grows Across the Commercial Building Stock.” Today in Energy, May 19, 2026.
- U.S. Energy Information Administration. Annual Energy Outlook 2026. April 8, 2026.
- Electric Power Research Institute. “Powering Intelligence: Updated U.S. Data Center Scenarios.” February 2026.
- International Energy Agency. “Demand.” Electricity 2026. 2026.
- International Energy Agency. “Executive Summary.” Electricity 2026. 2026.
- International Energy Agency. “Executive Summary.” Rare Earth Elements. 2025.
- Visual Capitalist. “Charted: China’s Grip on Critical Mineral Refining.” May 19, 2026.
- International Energy Agency. “With New Export Controls on Critical Minerals, Supply Concentration Risks Become Reality.” 2026.
- International Copper Study Group, cited in Reuters/Mining Weekly. “Global Refined Copper Market to Swing to Surplus in 2026, Group Says.” April 23, 2026.
- S&P Global. Copper in the Age of AI: The Challenges of Electrification. January 8, 2026.
- World Nuclear Association. “World Nuclear Fuel Report 2025: Investment in Nuclear Fuel Cycle Needed as Demand for Nuclear Power Grows.” September 5, 2025.
- World Nuclear News. “Investment Decisions Needed to Avoid Fuel Cycle Supply Gaps.” September 5, 2025.
- U.S. Energy Information Administration. “The United States Produced More Crude Oil Than Any Other Country in 2025.” July 9, 2026.
- U.S. Energy Information Administration. “U.S. Crude Oil Production Rose in 2025, Setting New Record.” 2026.
- Visual Capitalist. “Mapped: U.S. Oil Production by State in 2025.” July 29, 2026.
- RBN Energy. “Turn Me Loose – How Canada Became the World’s #4 Oil Producer.” 2026.
- Visual Capitalist. “All of the World’s Oil Reserves by Country, in One Visualization.” January 27, 2026.
- Natural Resources Canada. “Crude Oil Industry Overview.”
- Canadian Association of Petroleum Producers. “Oil and Natural Gas in Canada.”
- IHS Markit, cited in Business Wire. “Canadian Oil Sands Production Exceeds Pre-Pandemic Levels, But Lingering COVID Impacts and Other Factors Trim Long-Term Growth.”
- U.S. Energy Information Administration. “United States on Track for Record Natural Gas Production in 2026.” August 2026.
- Forbes. “Exports of U.S. Liquefied Natural Gas—Ten-Year Revolution Has Risks.” May 27, 2026.
- Reuters, cited in gCaptain. “U.S. Shatters LNG Export Record, Becomes First Nation to Top 100 Million Tons.” January 2, 2026.
- Statista. “Largest Operational LNG Terminals by Capacity Worldwide.” 2026.
- gCaptain. “Cheniere Ships 5,000th LNG Cargo as Corpus Christi Expansion Wraps Up.” August 2026.
- International Energy Agency. “Executive Summary.” Gas Market Report, Q1-2026. 2026.
- U.S. Energy Information Administration. “The 9th U.S. Liquefied Natural Gas Export Terminal, Golden Pass, Ships First Cargo.” April 2026.
- U.S. Energy Information Administration, cited in Forbes. “The U.S. Supplied 93% of Global LNG Export Growth in 2025.” July 19, 2026.
- Canada Energy Regulator. “Market Snapshot: Canada’s Natural Gas Production Kept Climbing in 2025.” May 2026.
- Canada Energy Regulator. “Market Snapshot: Exploring Canada’s Future in LNG Exports.” 2024.
- Statistics Canada. “Electricity Generation from Combustibles and Renewables Sharply Increase Amid Another Dry Year: Electricity Year in Review 2025.” March 2026.
- U.S. Energy Information Administration. “Hydropower.” Energy Kids. 2026.
- Canada Energy Regulator. “Market Snapshot: Overview of 2025 Canada-U.S. Energy Trade.” May 2026.
- Enbridge Inc. “Enbridge’s Liquids Pipelines Network” and “Mainline Optimization.” 2026.
- Canada Energy Regulator. “Market Snapshot: Overview of 2025 Canada-U.S. Energy Trade.” May 2026.
- Visual Capitalist. “Mapped: America’s Oil Imports by Country.” 2026.
- Investing News Network. “Athabasca Basin a Key Source of Global Uranium Supply.” January 2026.
- World Nuclear Association. “World Uranium Mining Production.” 2026.
- Cameco Corporation. “2025 Annual Report.” 2026.
- U.S. Energy Information Administration. “The United States Operates the World’s Largest Nuclear Power Plant Fleet.” April 2025.
- Canadian Nuclear Association. “Operating Power Plants.” August 2025.
- U.S. Geological Survey. “Potash.” Mineral Commodity Summaries 2025. 2025.
- Natural Resources Canada. “Nickel Facts.” 2026.
- Natural Resources Canada. “Cobalt Facts.” 2026.